
20 years of listening to the sky – introducing mode_s_wind
This is the 20th anniversary year of receiving Mode-S and ADS-B messages at my site almost 24/7. Everything started with a Kinetic Avionics SBS-1 receiver.
Memories: Pictures below. First steps with SBS-1 receiver at 2006. Receiving site has been same all these 20 years to keep time-series fully intact.
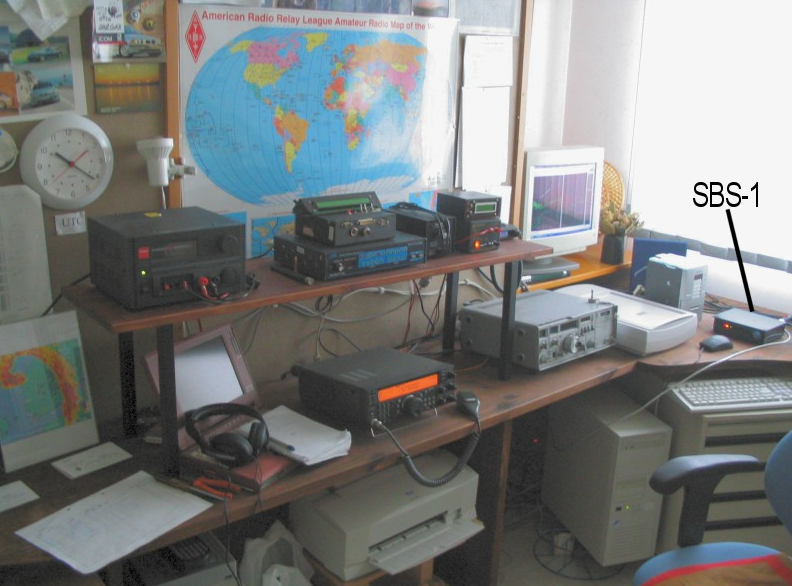
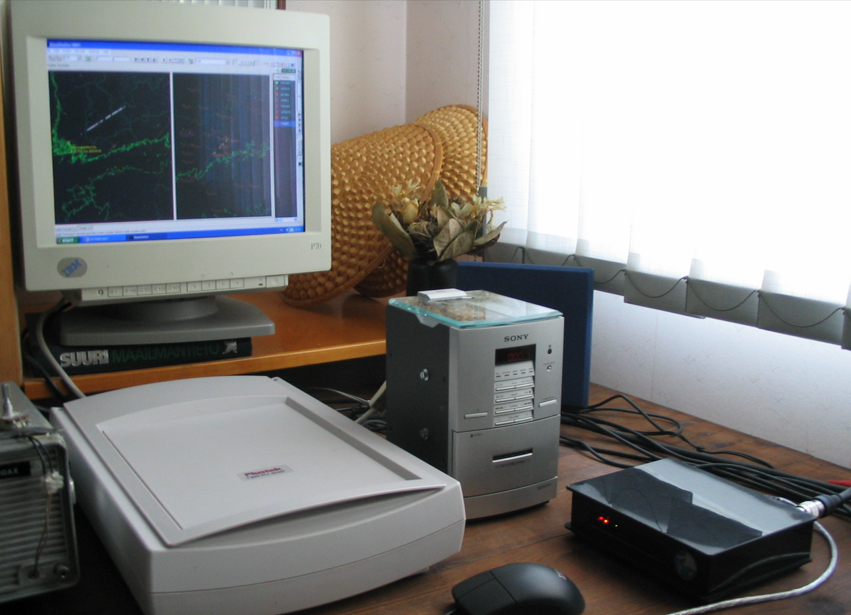
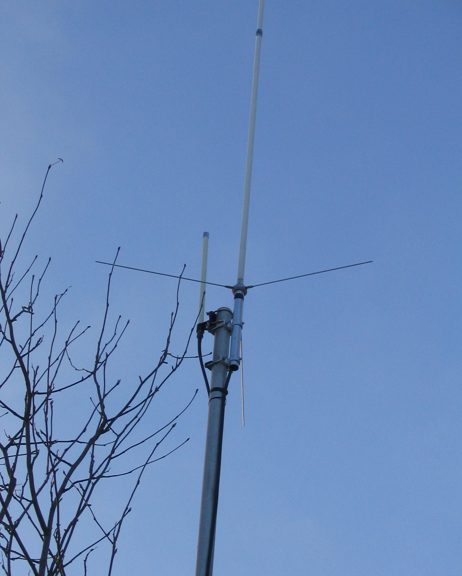
1090 MHz antenna setup in early days 2006
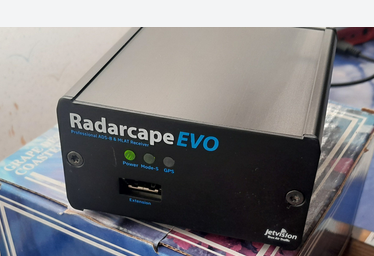
Current Radarcape at 2025
Over the years I have run many experiments, including my own hobby research on what can be learned from the received data. All of that work has now been brought together into one toolbox, mode_s_wind. The code and documentation are on GitHub: https://github.com/oh2gax/mode_s_wind
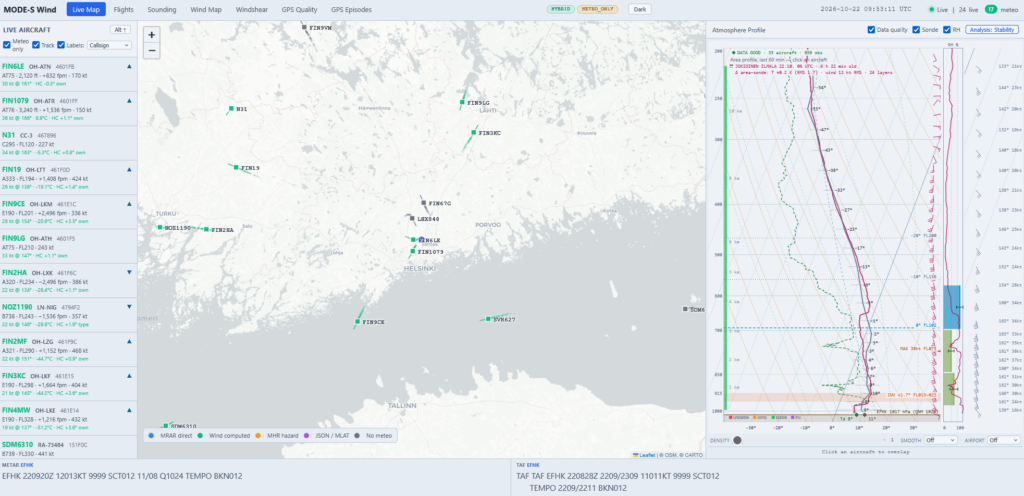
Aircraft as weather stations
Every airliner carries an air-data computer that knows its airspeed, Mach number, heading and position very accurately. A ground station can’t read the onboard sensors directly. But when air traffic control radar interrogates an aircraft, the replies (Mode-S Enhanced Surveillance, EHS) carry exactly these values. mode_s_wind decodes them from a Jetvision Radarcape receiver here near Helsinki-Vantaa and turns them into meteorological observations:
- Wind from the difference between the aircraft’s ground vector (track and groundspeed) and its air vector (heading and true airspeed). Each airframe’s small heading error is learned automatically and corrected.
- Air temperature from the true airspeed and the Mach number.
- Direct weather reports (BDS 4,4 / 4,5) when an aircraft happens to send them.
- Heights of the pressure surfaces from the difference between the aircraft’s GNSS and barometric altitude in ADS-B. The heights are calibrated automatically against radiosondes.
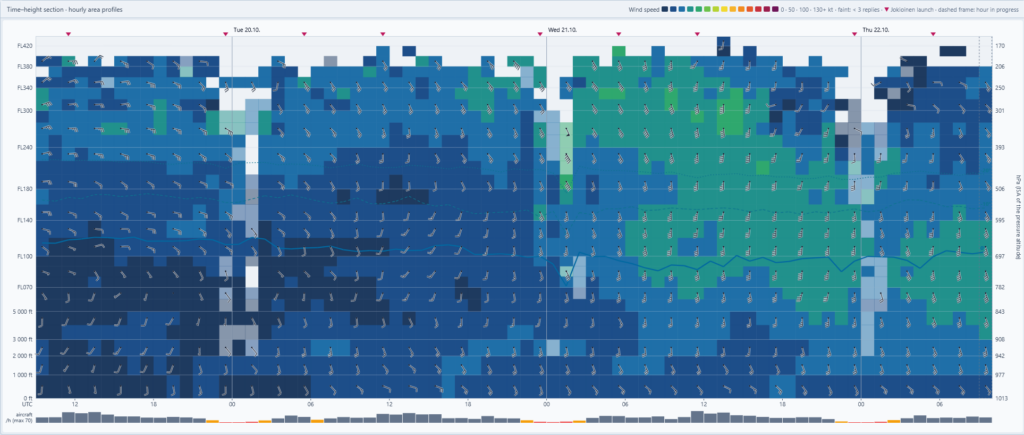
On a normal day this gives tens of thousands of wind and temperature observations within about 200 km of the airport. That is far more than the two or three radiosondes launched each day can provide.
What the toolbox shows
- Live map of all traffic, coloured by meteorological data source, with an atmosphere-profile panel.
- Skew-T soundings built from all aircraft in the area, hourly profiles archived indefinitely, and the Jokioinen radiosonde for comparison with automatic verification. A time–height section shows how the atmosphere evolves over days.
- Wind map with gridded winds and temperatures by flight level: isotachs, streamlines, jet-stream axis, thermal wind, height contours, geostrophic wind and vertical cross-sections.
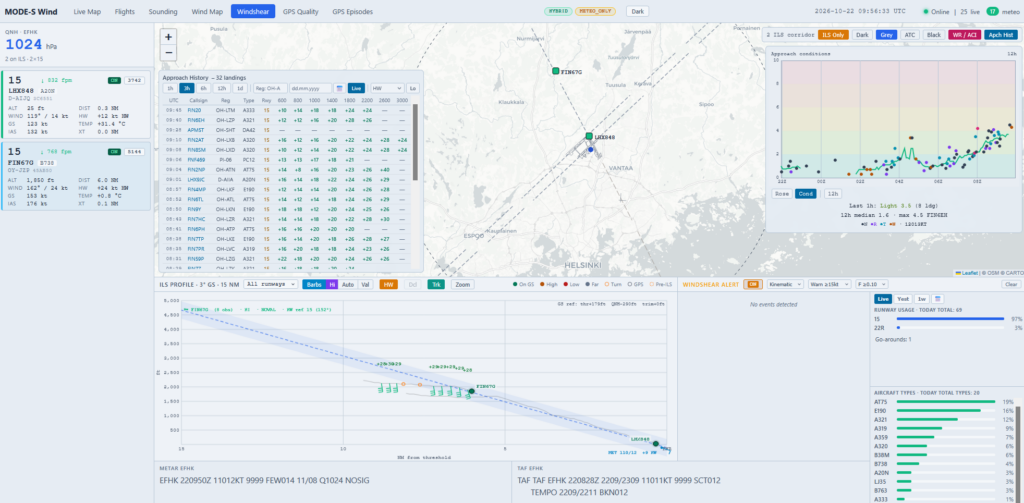
- Approach and windshear monitor for Helsinki-Vantaa: winds on final, six windshear detection algorithms, a go-around detector and an approach-conditions index for every landing.
- GPS quality monitoring, which is very topical around the Baltic Sea. It detects GNSS degradation, jamming and spoofing from the aircraft’s own reports, with an episode-by-episode history.
Everything runs on a small Linux computer, even a Raspberry Pi, with a local database and a web interface.
The science behind it
Using Mode-S EHS data for meteorology is now well-established research. KNMI’s EMADDC service has delivered Mode-S winds and temperatures operationally since 2019. ECMWF and the UK Met Office assimilate Mode-S winds into their global forecast models, and ECMWF has used global Mode-S data since 2025. Recent studies from ECMWF, the Met Office and the Australian Bureau of Meteorology show clear forecast benefits from the winds. Temperatures are more challenging, especially at low levels where the Mach number’s coarse resolution limits accuracy.
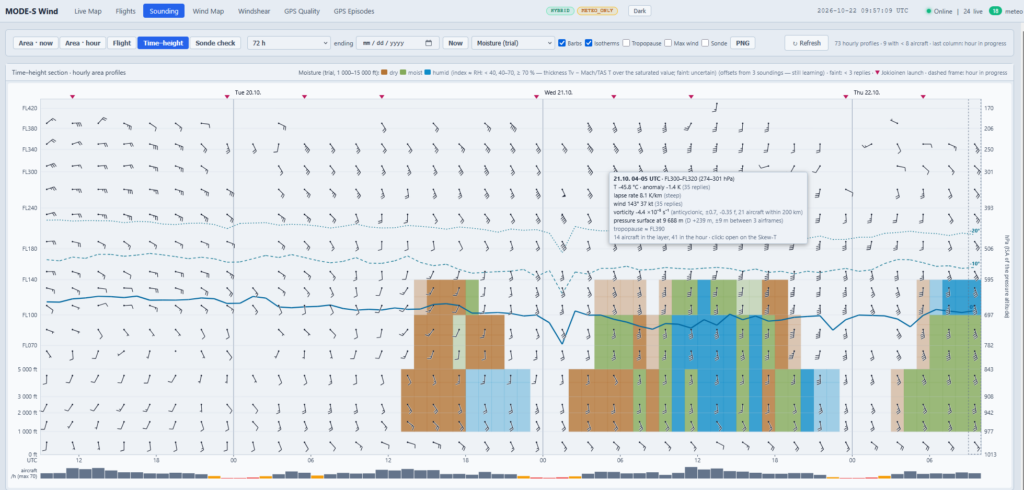
The next frontier is humidity, the variable with the fewest upper-air observations. A 2026 KNMI study shows that comparing an aircraft’s GNSS height with its pressure altitude during climbs and descents gives the virtual temperature of the air. Combined with the Mach/TAS temperature, that difference reveals the moisture of the layer. Researchers at Exeter are also measuring how ADS-B radio signals bend in humid air.
mode_s_wind now includes its own trial moisture indicator based on the virtual-temperature idea, compared with the Jokioinen radiosonde. It is still an experiment. In dry autumn air the signal is only a few tenths of a degree. The summer boundary layer will be the real test.
Twenty years in, the receiver is still finding new things to learn from the sky.